Setting up AWS Managed Grafana in minutes to display metrics from Amazon Managed Prometheus and CloudWatch

Grafana is the most popular monitoring open source tool. Trusted by hundreds of companies across the world, Grafana is available as a managed service on AWS since August 2021.
In this article, we will configure in a minute a Grafana workspace and his applications.
Setup Grafana
In March 2024, Amazon Managed Grafana is only available in the following regions:
Service is available: ✅ | Service not yet available: ⏳
| Region | City | Code | Availability |
|---|---|---|---|
| US | North Virgina | us-east-1 | ✅ |
| US | Ohio | us-east-2 | ✅ |
| US | North California | us-west-1 | ⏳ |
| US | Oregon | us-west-2 | ✅ |
| Asia P. | Hong Kong | ap-east-1 | ⏳ |
| Asia P. | Mumbai | ap-south-1 | ⏳ |
| Asia P. | Tokyo | ap-northeast-1 | ✅ |
| Asia P. | Seoul | ap-northeast-2 | ✅ |
| Asia P. | Osaka | ap-northeast-3 | ⏳ |
| Asia P. | Singapore | ap-southeast-1 | ✅ |
| Asia P. | Syndey | ap-southeast-2 | ✅ |
| Europe | Frankfurt | eu-central-1 | ✅ |
| Europe | Ireland | eu-west-1 | ✅ |
| Europe | London | eu-west-2 | ✅ |
| Europe | Paris | eu-west-3 | ⏳ |
| Europe | Stockholm | eu-north-1 | ⏳ |
| South America | Sao Paulo | sa-east-1 | ⏳ |
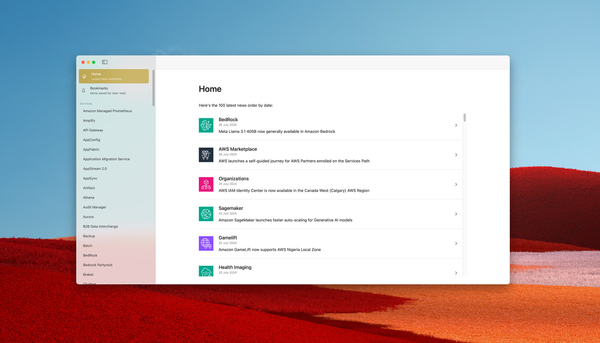
First, search for "Grafana" in the service list:
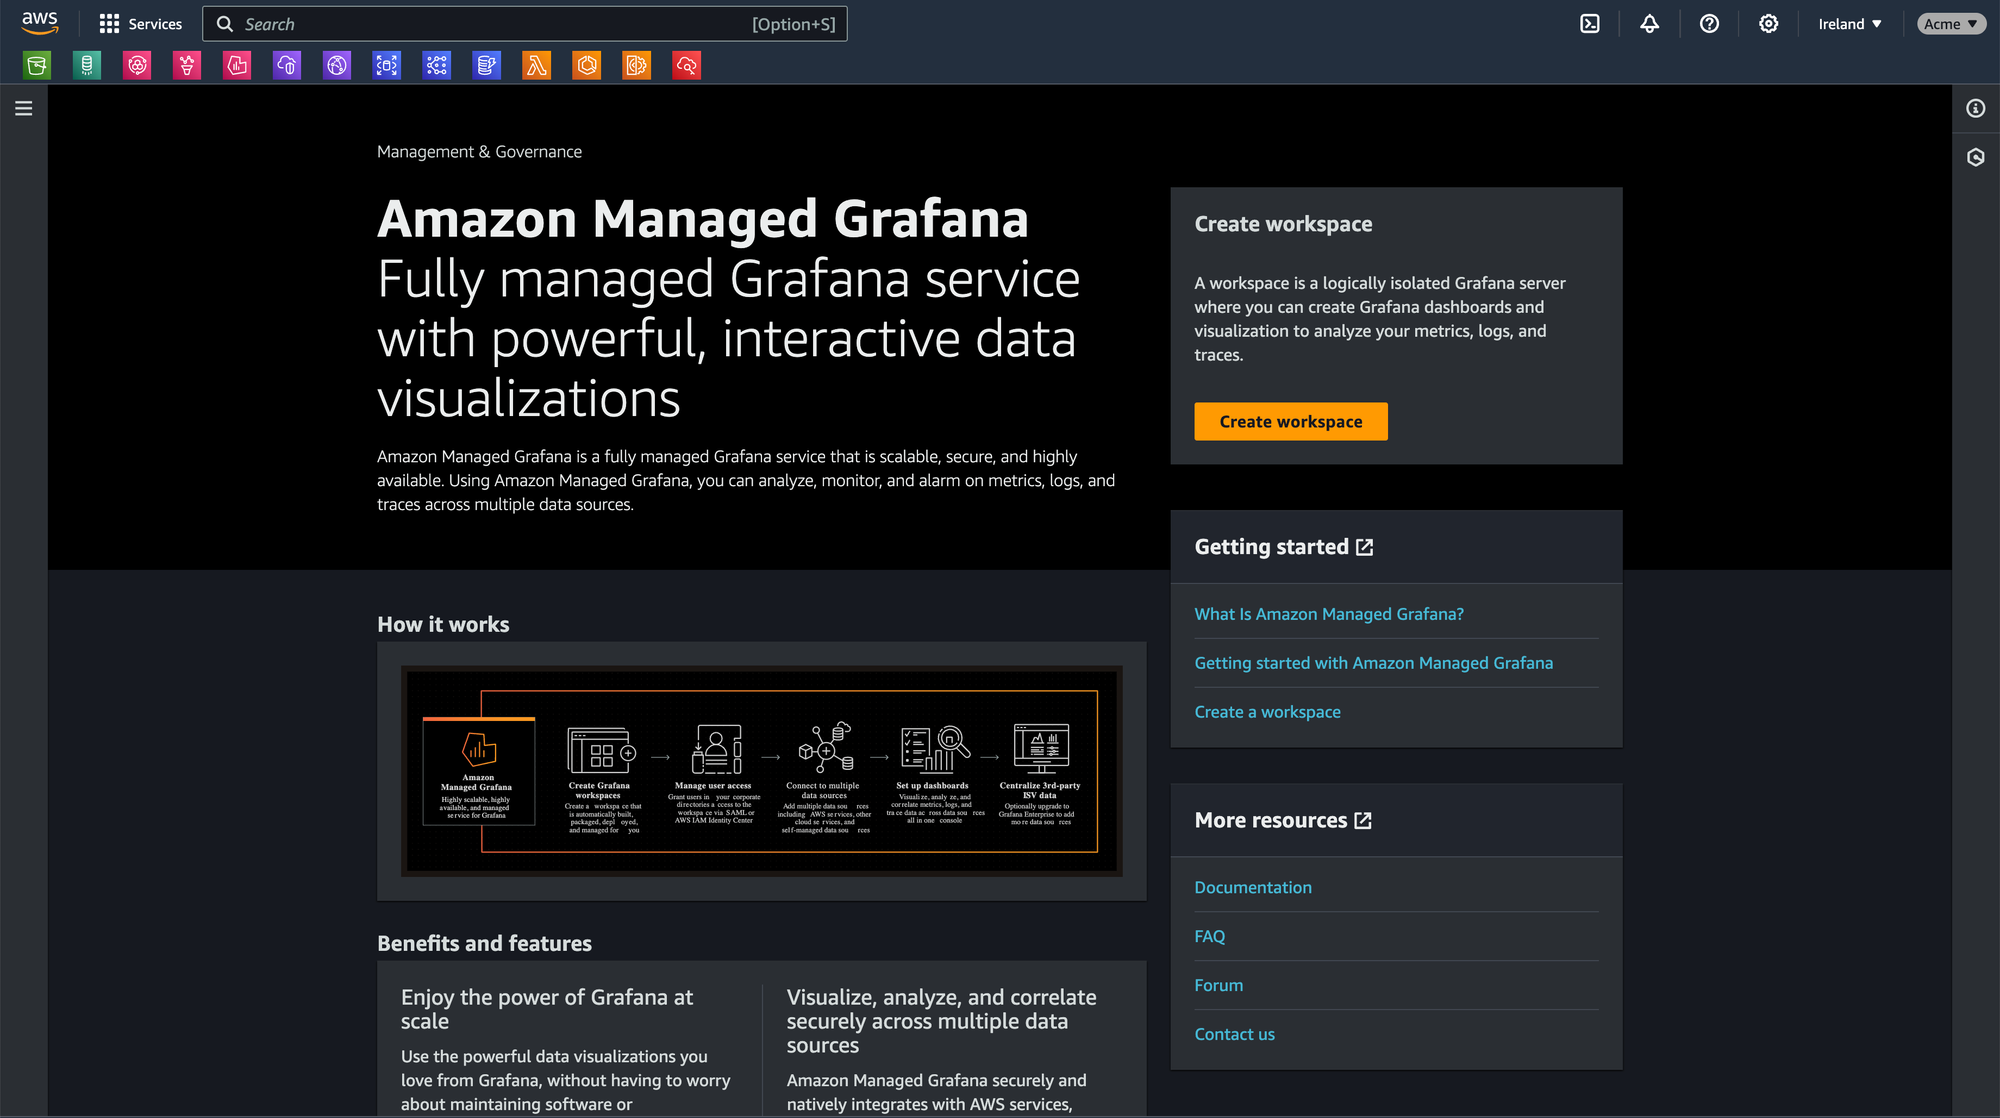
Create a workspace:
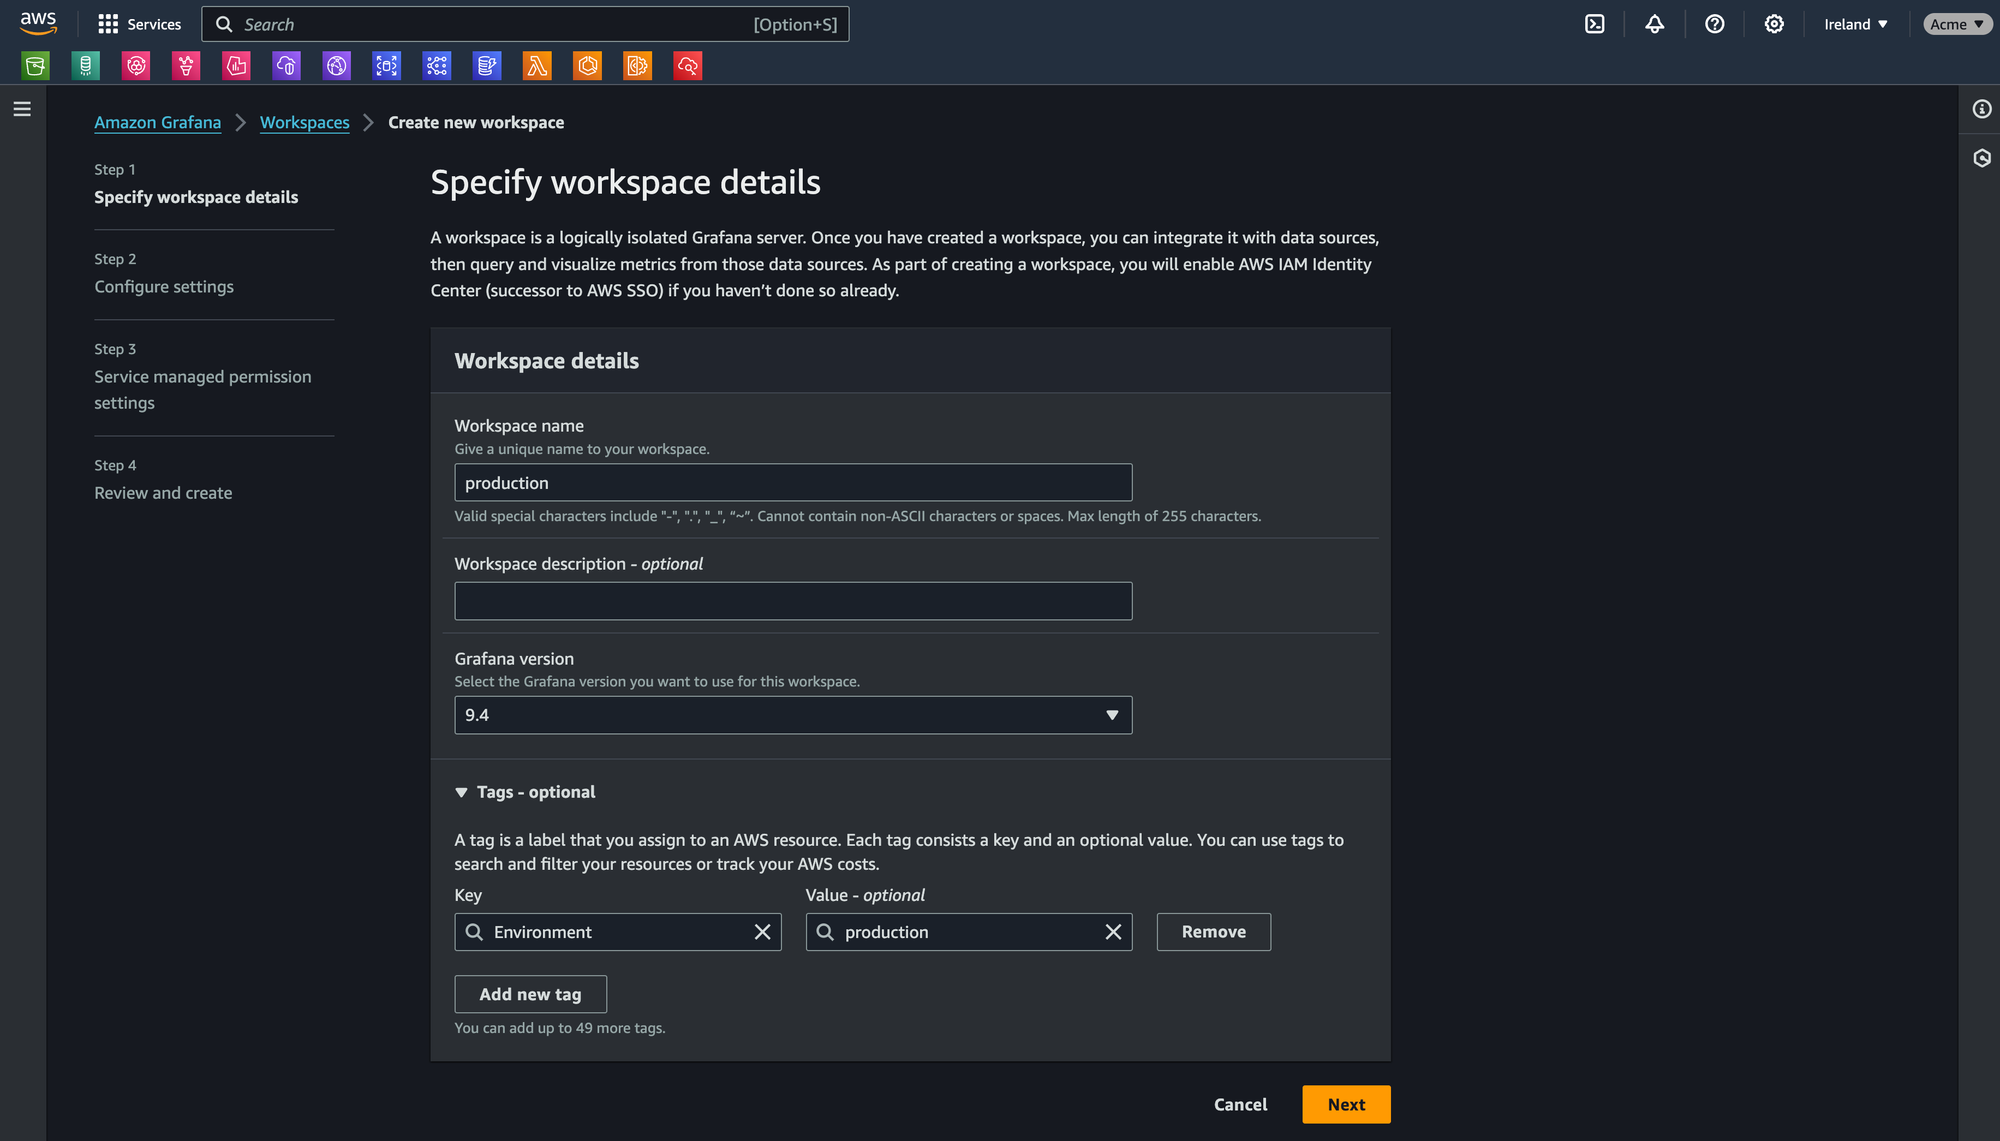
And configure the settings: you need to choose between two authentication access options (AWS SSO and SAML).
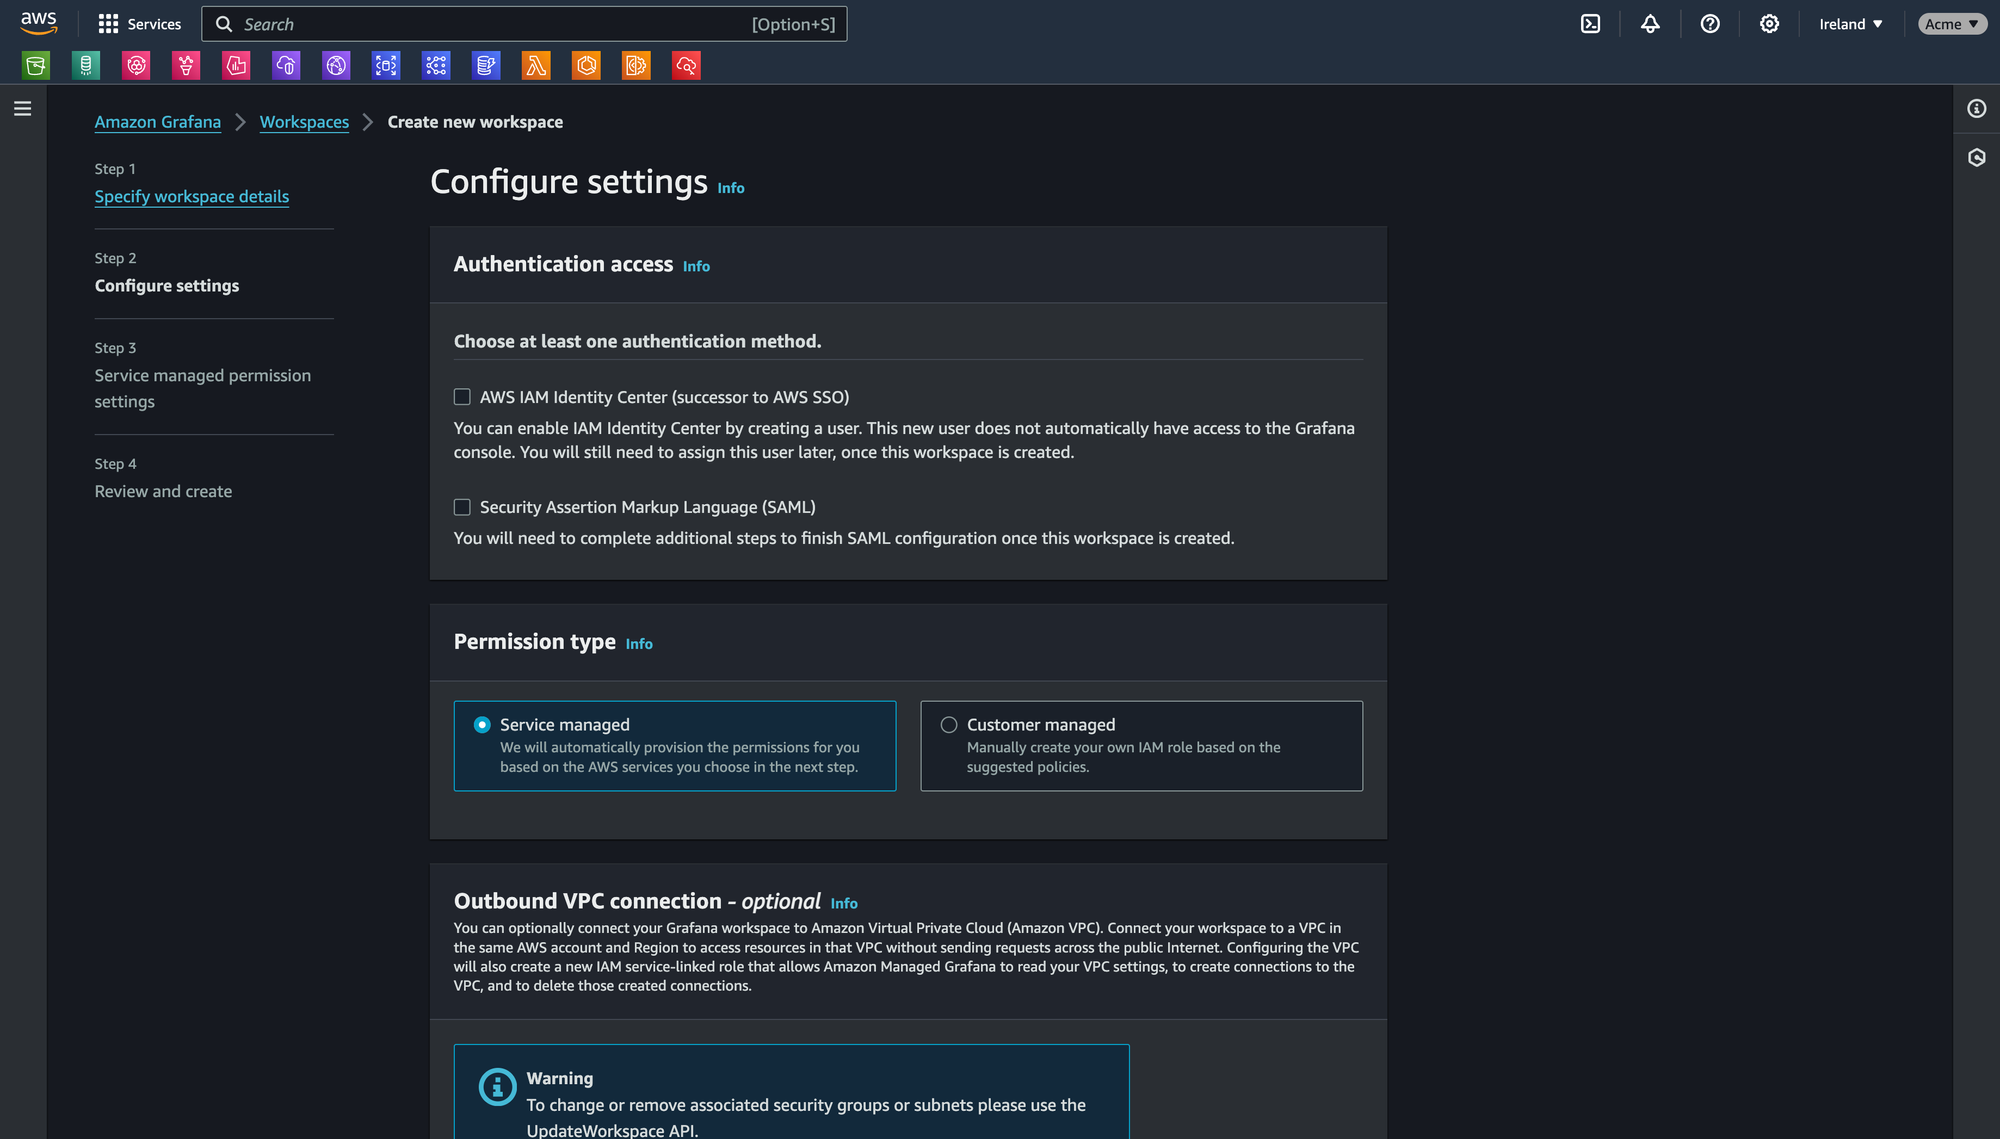
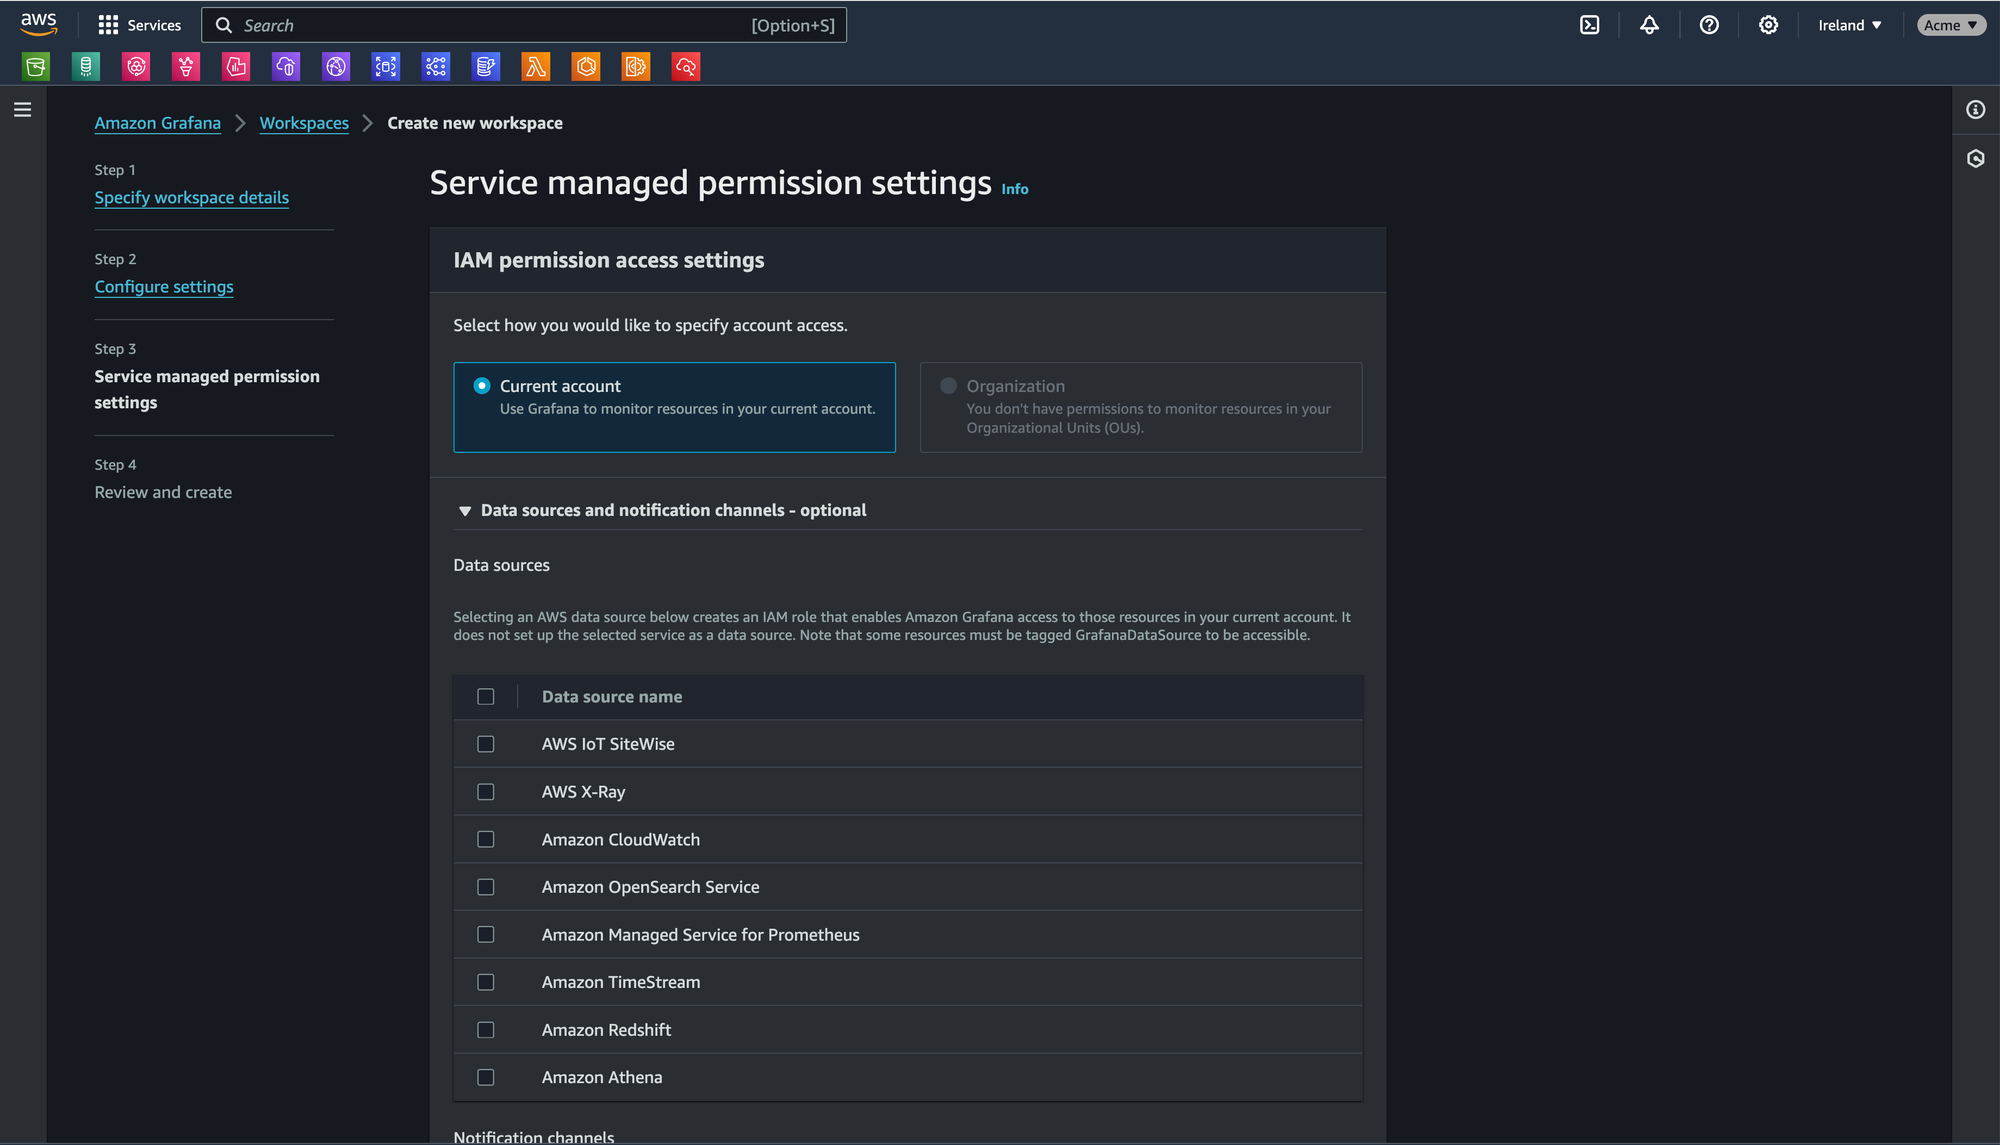
On the next step page, you will be able to add pre-configured data sources managed by AWS, such as Cloudwatch or Amazon Managed Service for Prometheus. On this example, both will be activated.
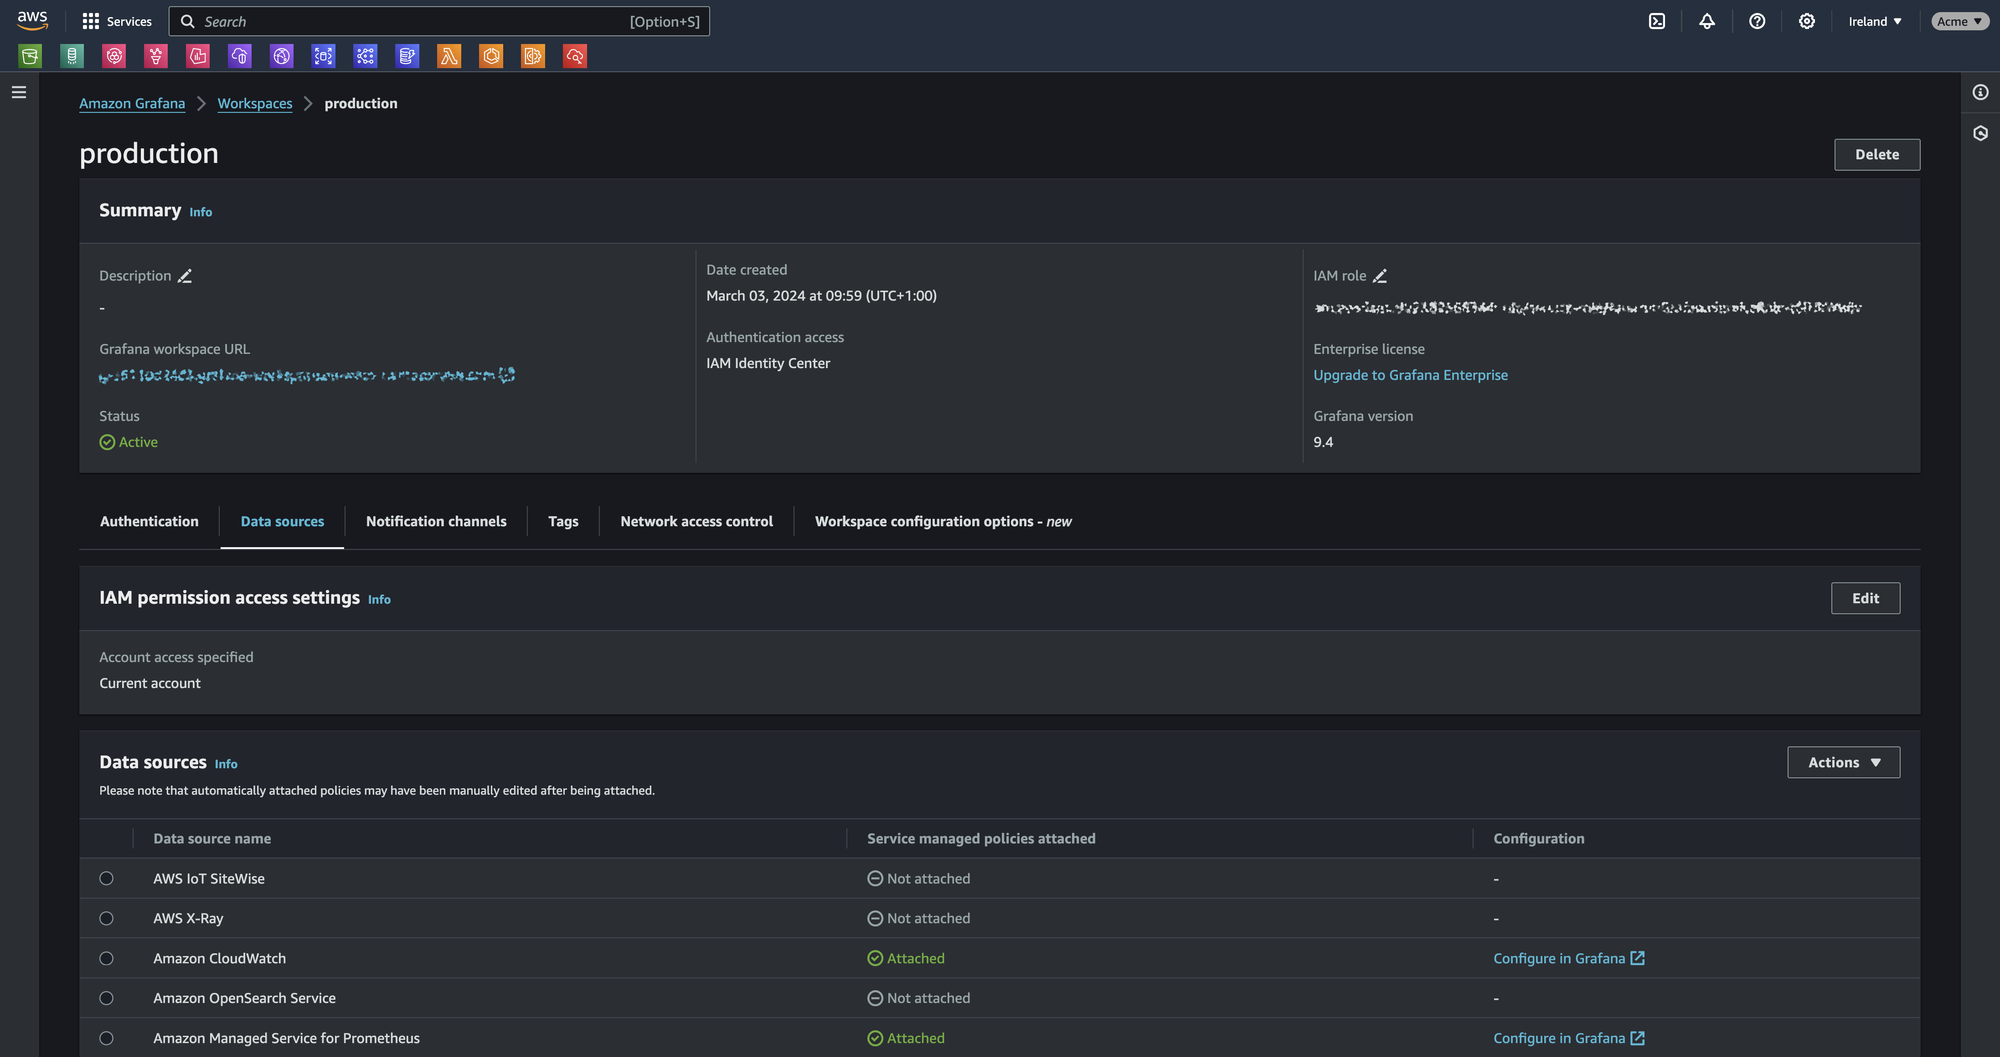
You have successfully configured your Grafana workspace:
Configure access
On the workspace summary, search for "authentication" tab, and configure access using the authentication method of your choice.
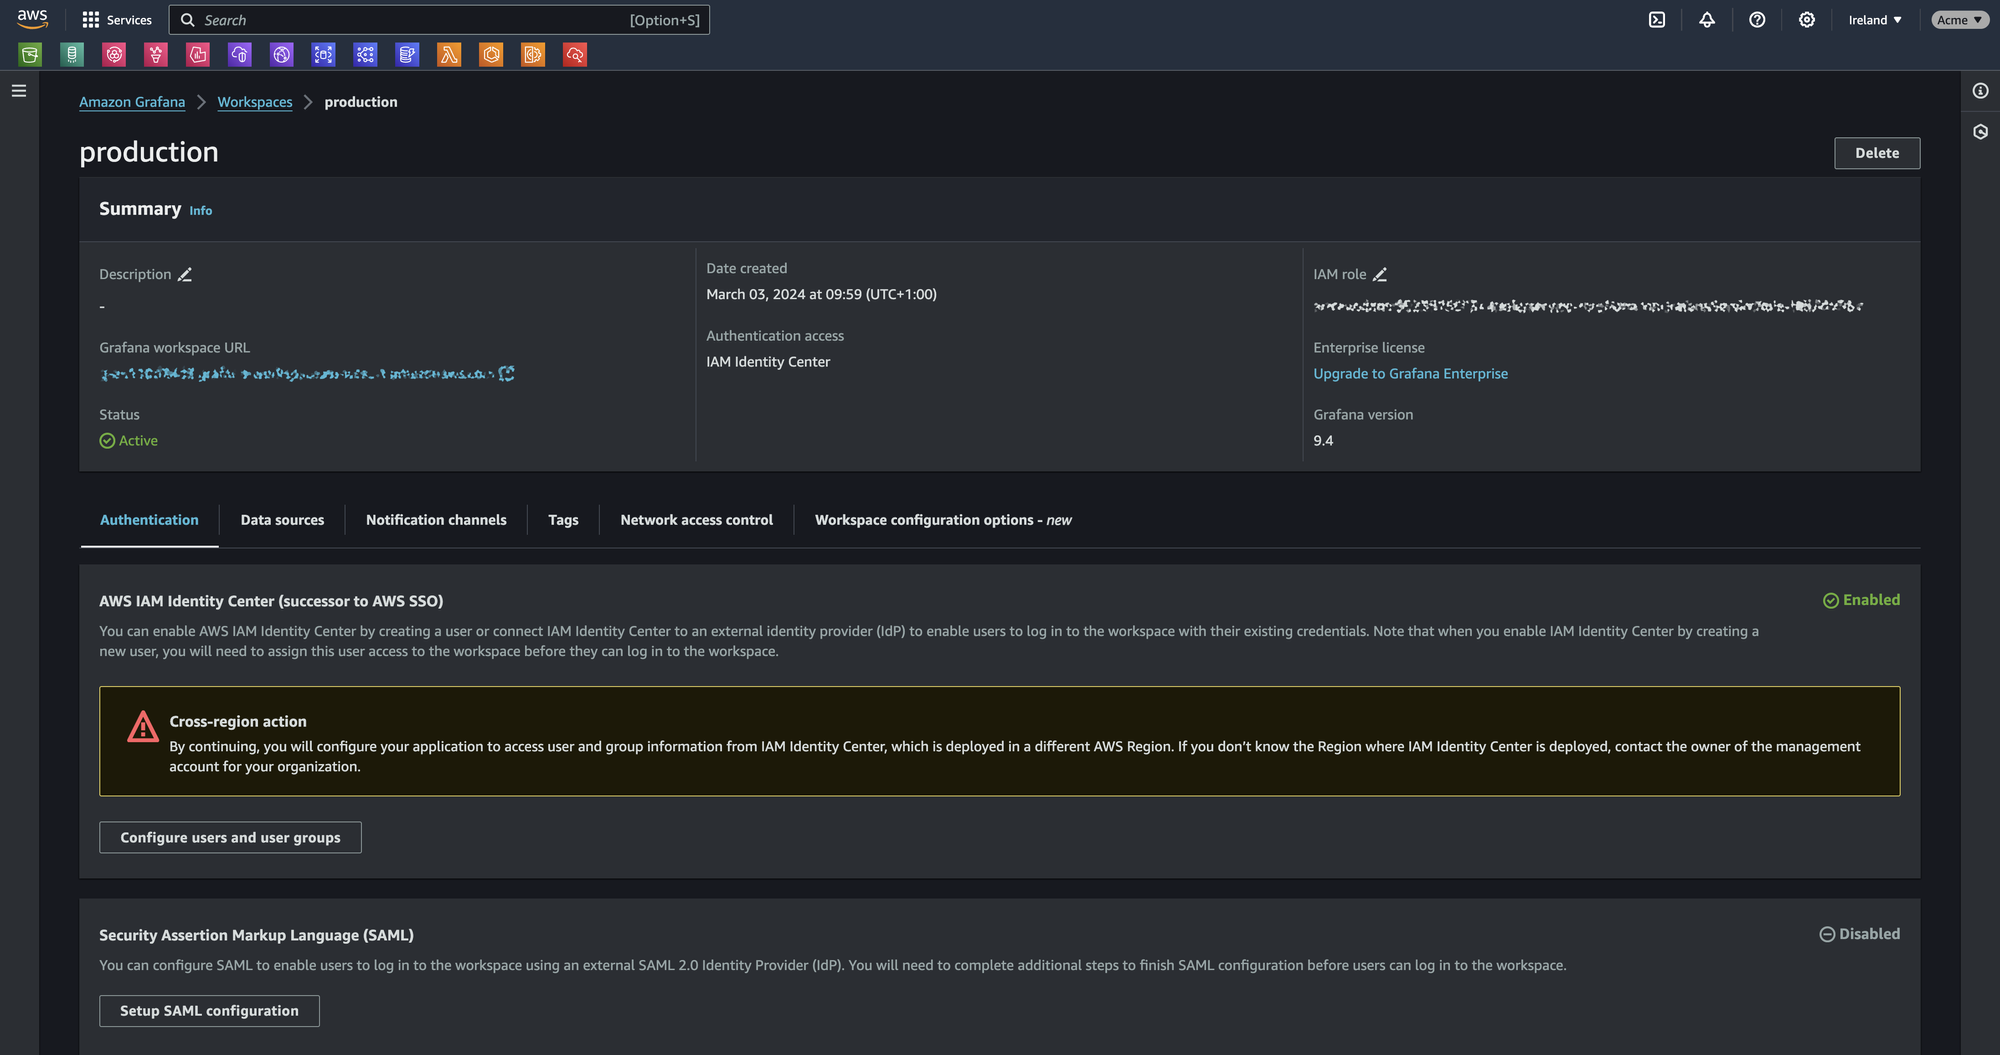
For the purpose of the setup, you need to be admin to configure Grafana datasource and apps.
Setup apps
Use the Grafana workspace URL to login to Grafana. This URL can be found in the summary header of your workspace.
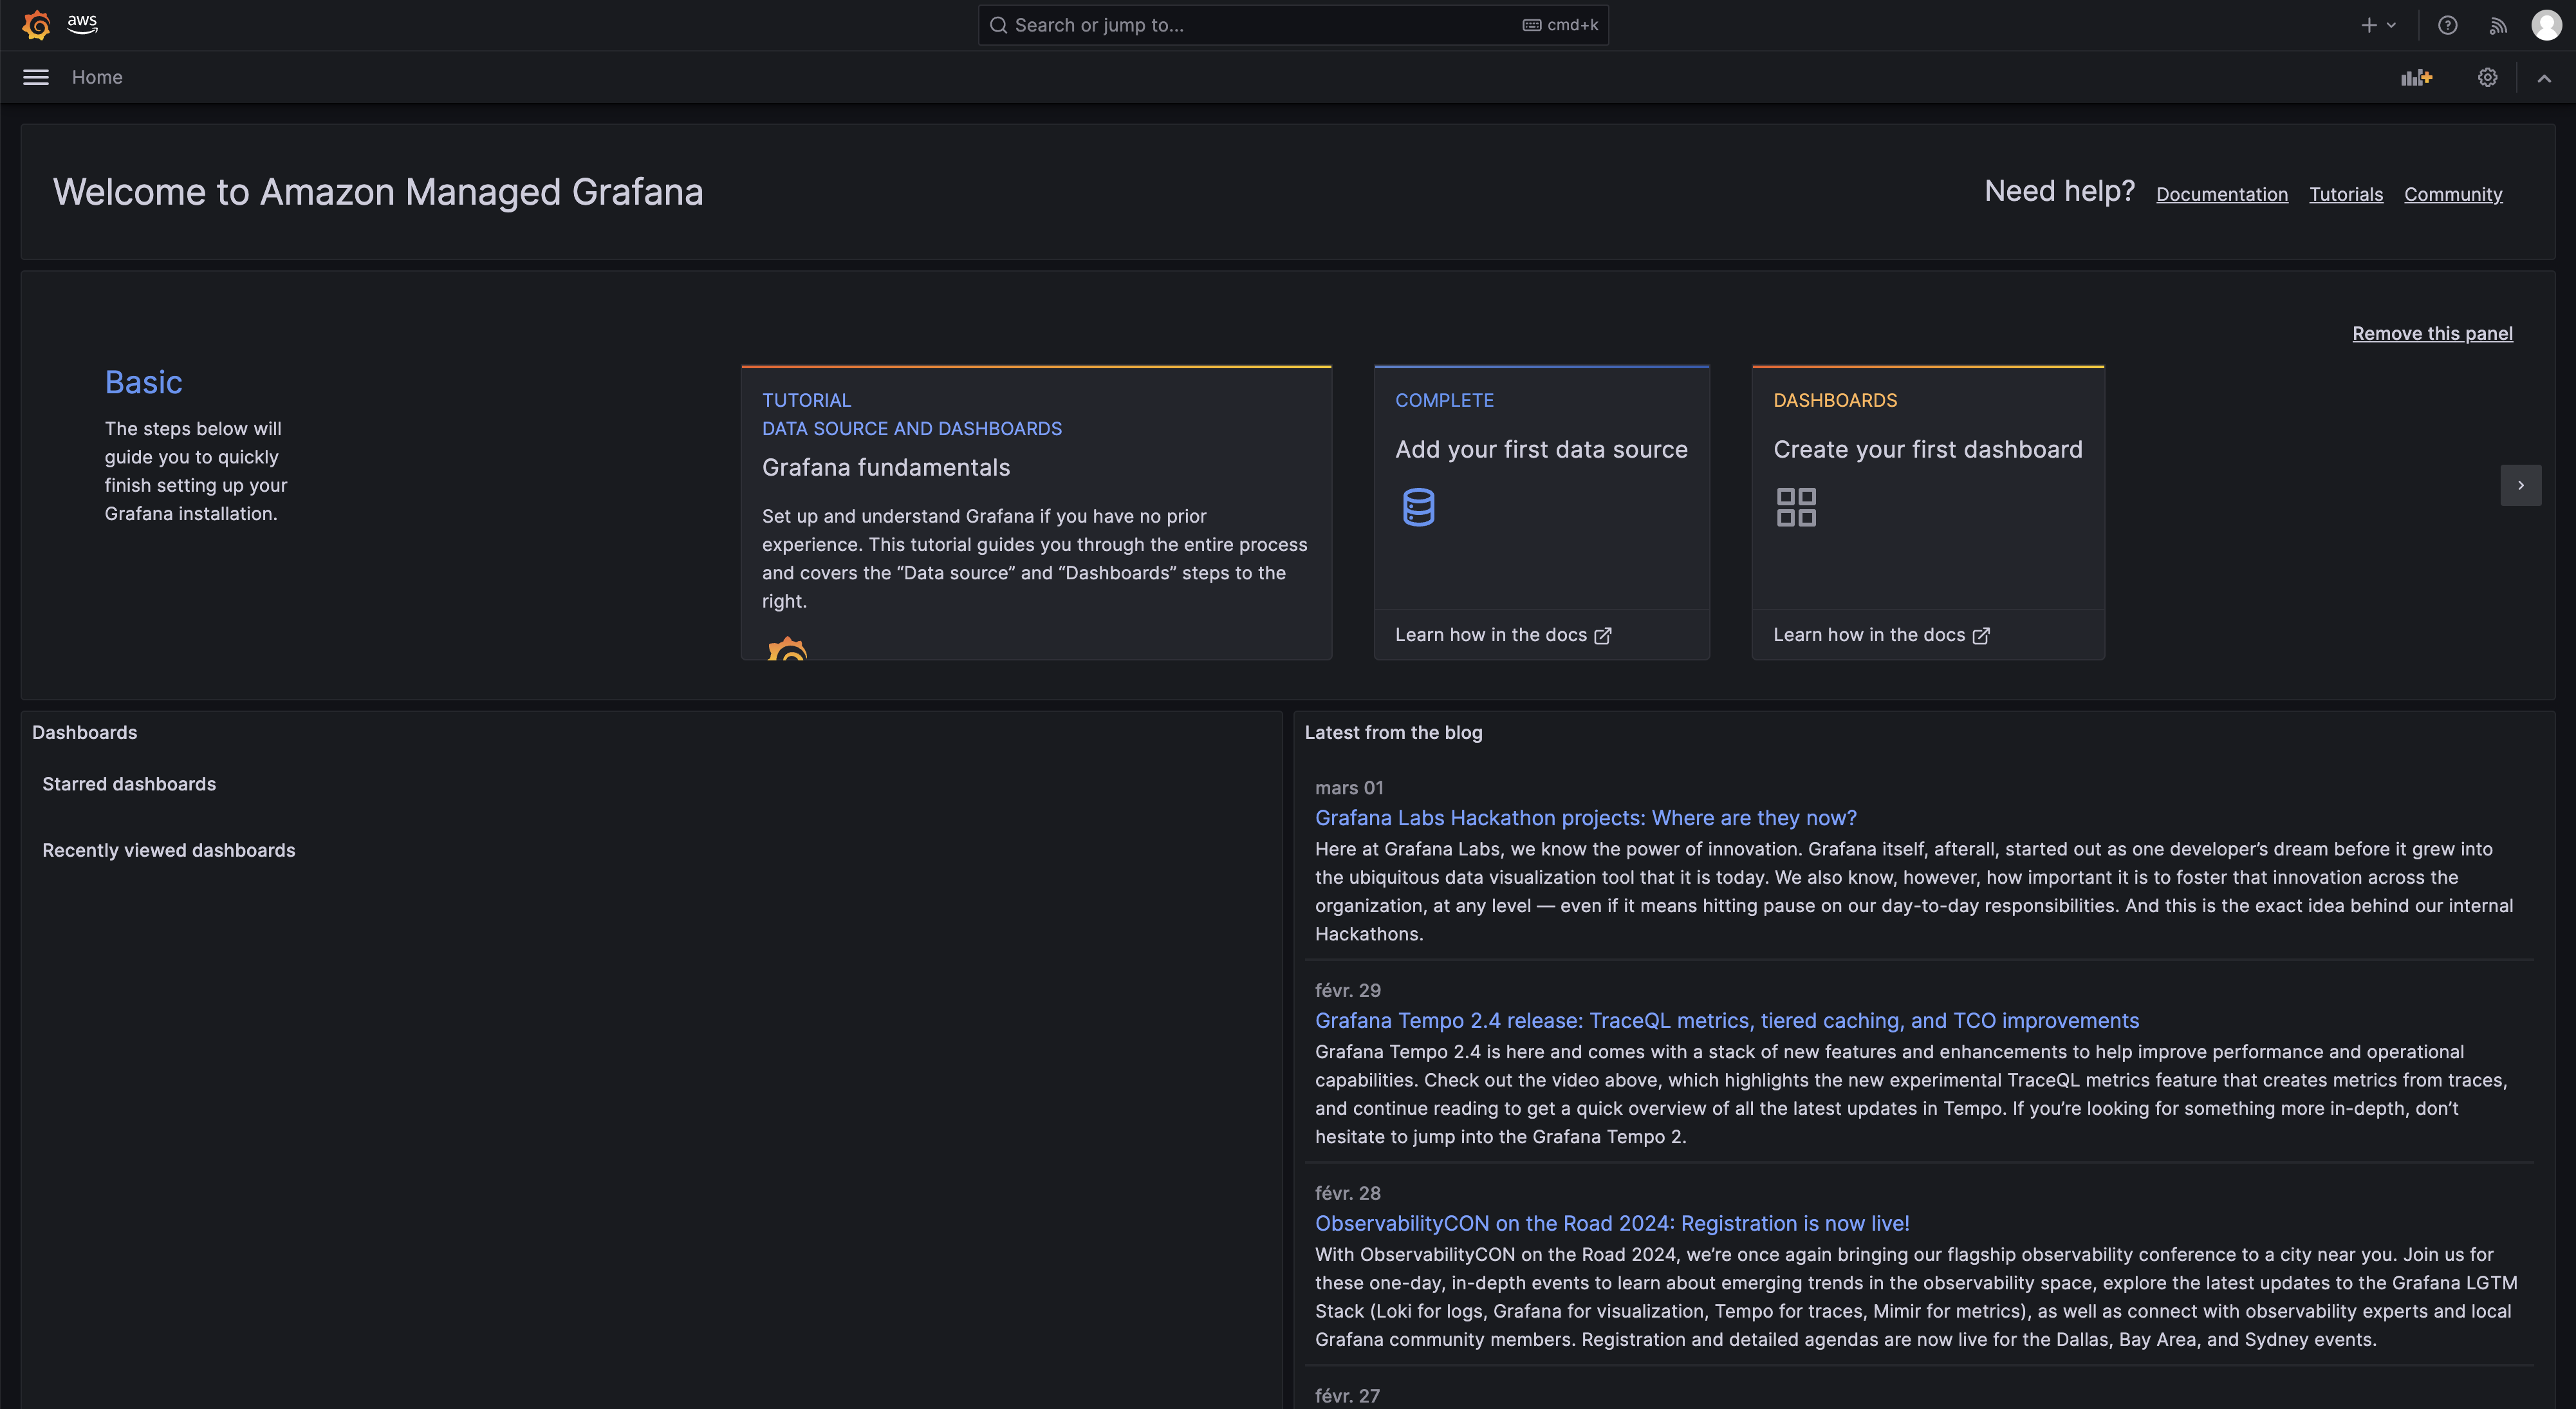
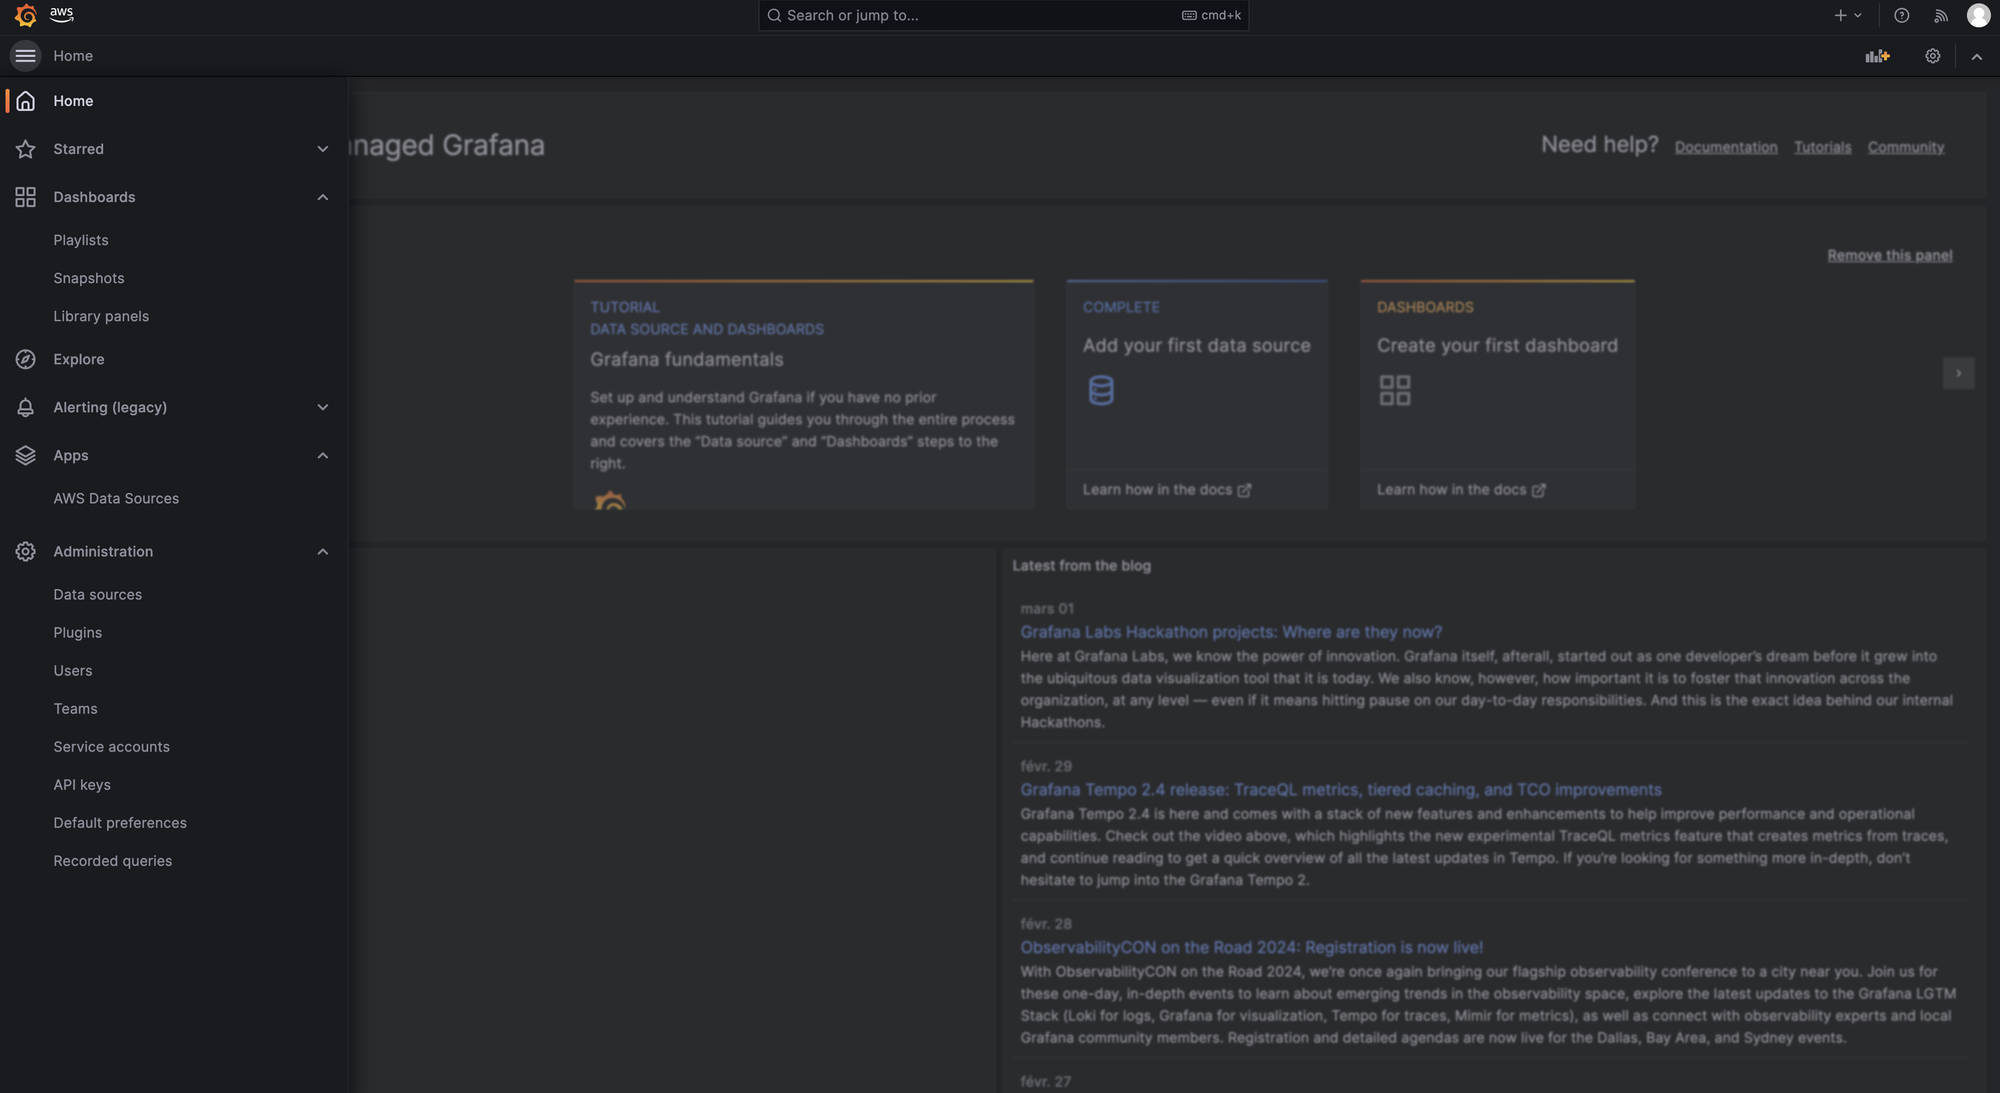
Display the menu using the button next to "Home", and search for "AWS Data Sources" in "Apps" section:
For each AWS data source activated, you must configure it prior to use it in dashboards panels. Select a service in the dropdown list, choose a region, then validate by clicking on "Add data source":
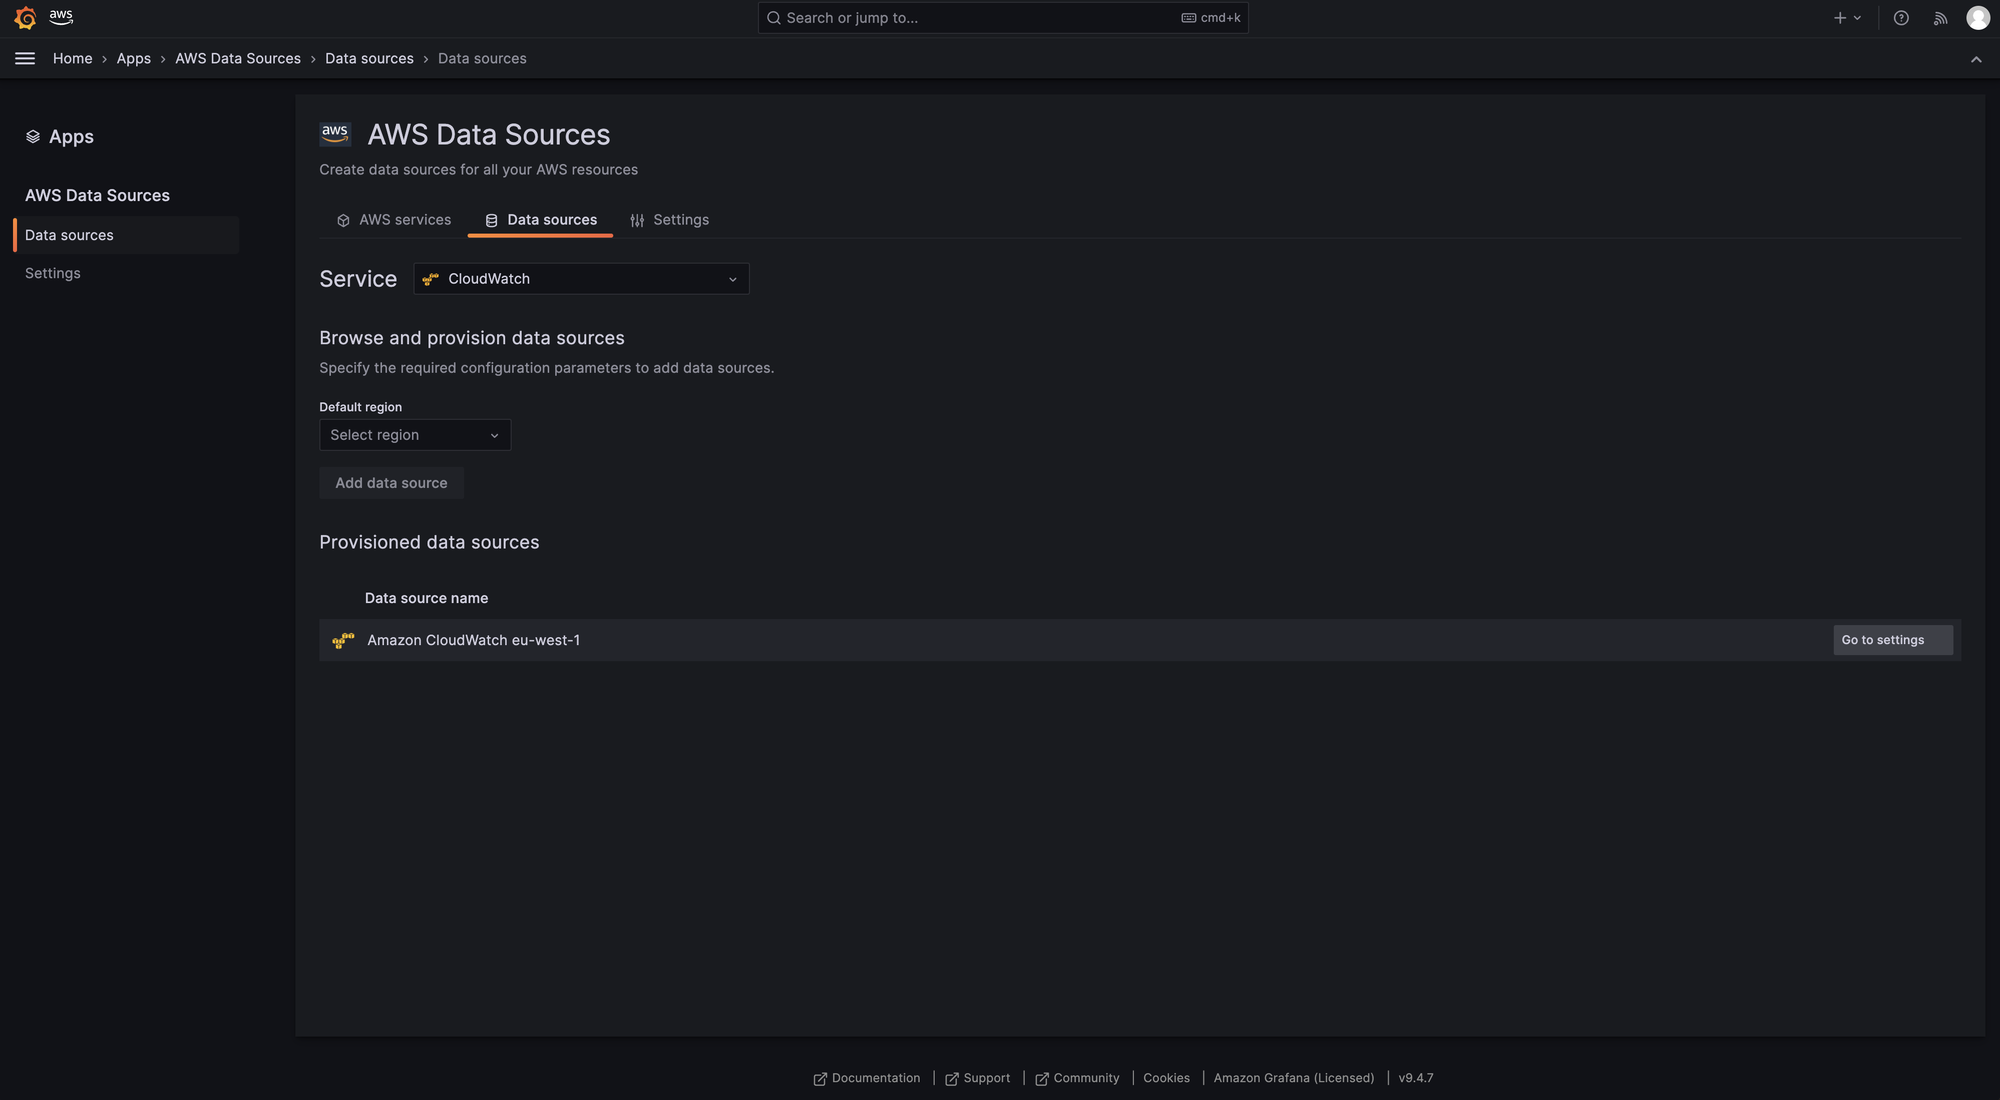
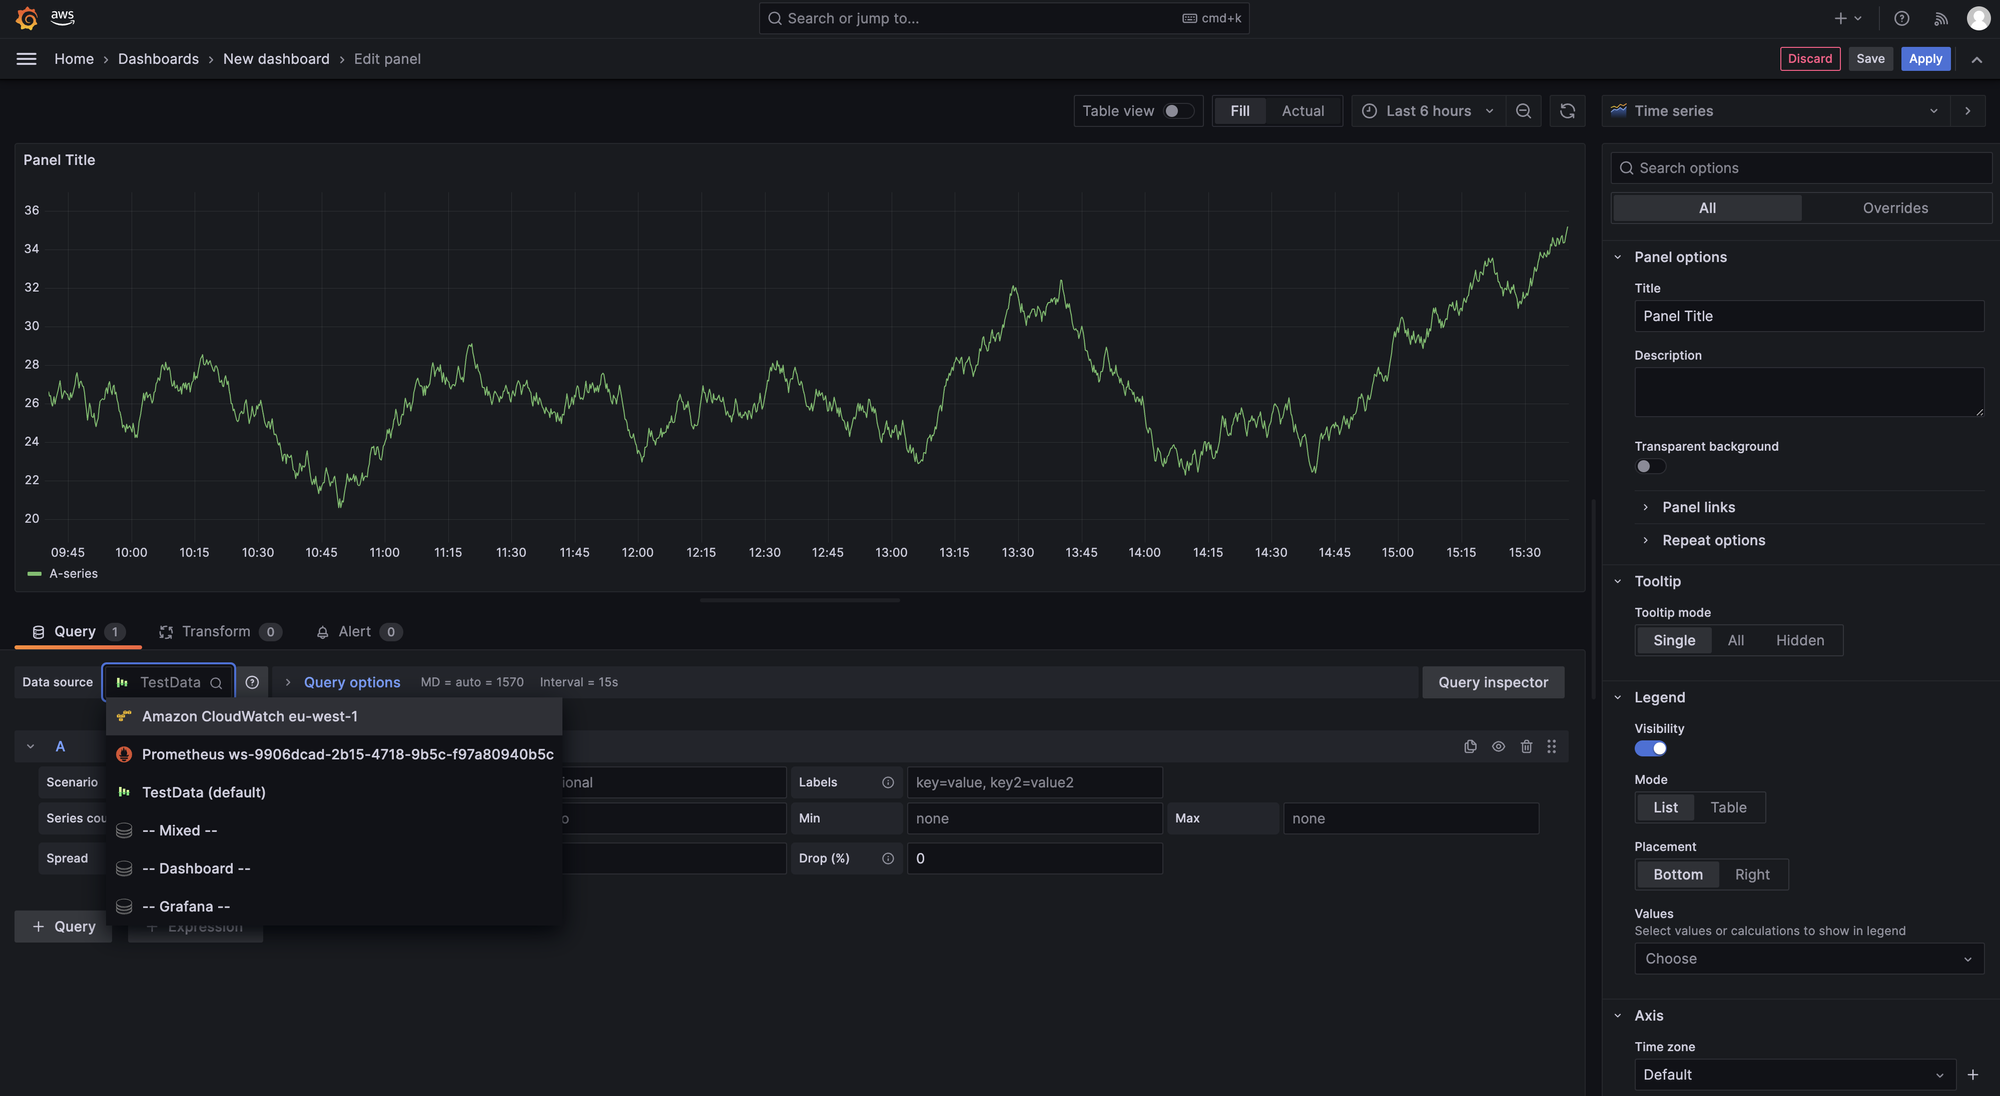
Data source are now ready to use!
This marks the end of this article. In summary Amazon Managed Grafana is a powerful yet simple way to use a tool everyone trust.