Amazon Managed Prometheus reference architecture

Amazon Managed Service for Prometheus is a Prometheus-compatible service that monitors and provides alerts on containerized applications and infrastructure at scale.
A few weeks ago, I faced a problem: how to monitor my applications running on AWS ECS and AWS Lambda in a resilient and efficient manner?
I have some strong constraints to match with the new monitoring solution :
- Must be PromQL (Prometheus Query Language) compatible - I need to keep dozen of business rules related to the monitoring, running since years.
- Alert manager must be highly available
- Solution must be scalable - my workload are expected to growth months after months
- Solution must be easy to maitain and upgrade
- Solution must ensure metric persistance during a long period.
I discovered Amazon Managed Prometheus, that perfectly match my needs :
- Scalability - Amazon Managed Service for Prometheus is specifically architected to handle the high cardinality monitoring data with a large volume of tags and dimensions that is generated by container-based applications. Amazon Managed Service for Prometheus manages the operational complexity of elastically scaling the ingestion, storage, and querying of metrics.
- Availability - Amazon Managed Service for Prometheus is highly available and deployed in multiple AWS Regions and across Availability Zones, which are connected with low-latency, high-throughput, and highly redundant networking. With Availability Zones, you can design and operate applications and databases that automatically fail over between zones without interruption. Availability Zones are more highly available, fault tolerant, and scalable than traditional single or multiple data center infrastructures. AWS delivers the highest network availability of any cloud provider.
Architecture
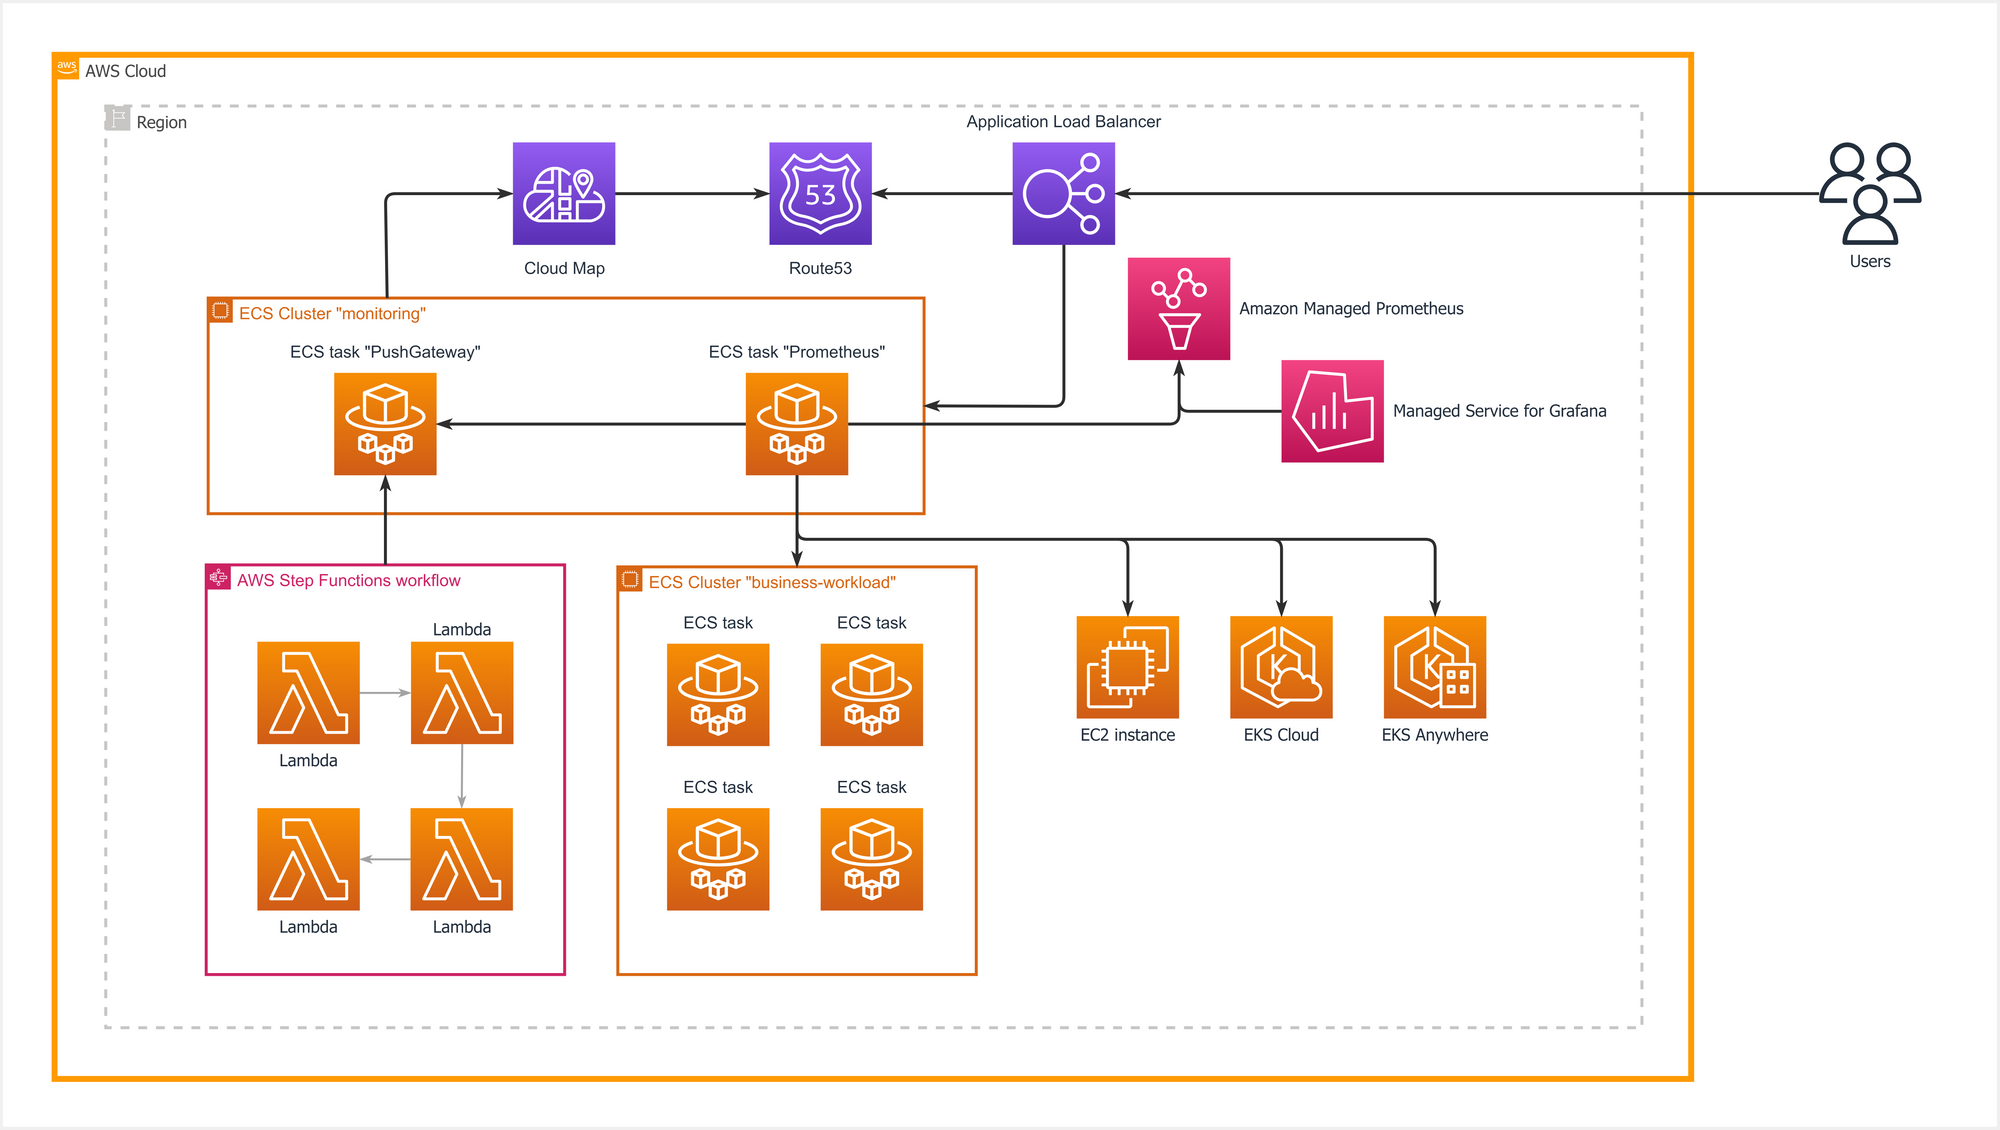
This architecture consists of multiple sections:
- Workloads are operated through an ECS cluster, multiple EKS clusters, Lambda, Step Functions, and EC2 instances.
- AWS requires users to deploy and manage a standard Prometheus server to push metrics to Amazon Managed Prometheus. Since ephemeral workloads like Lambdas cannot have logs and metrics scraped directly, a Prometheus Push Gateway is needed to allow these workloads to push metrics. The Prometheus Push Gateway is then scraped by the standard Prometheus server.
- The standard Prometheus server will push data to Amazon Managed Prometheus using the Prometheus remote_write configuration.
- Since the standard Prometheus server (running on ECS) needs to scrape data from other ECS clusters or EC2 instances, AWS Cloud Map is utilized to define user-friendly names for easy and dynamic discovery.
Links
Infrastructure Monitoring - Amazon Managed Service for Prometheus - AWS
Amazon Managed Service for Prometheus is a monitoring and alerting service that makes it easier to monitor containerized applications and infrastructure securely, at scale.